Original LinkedIn Post
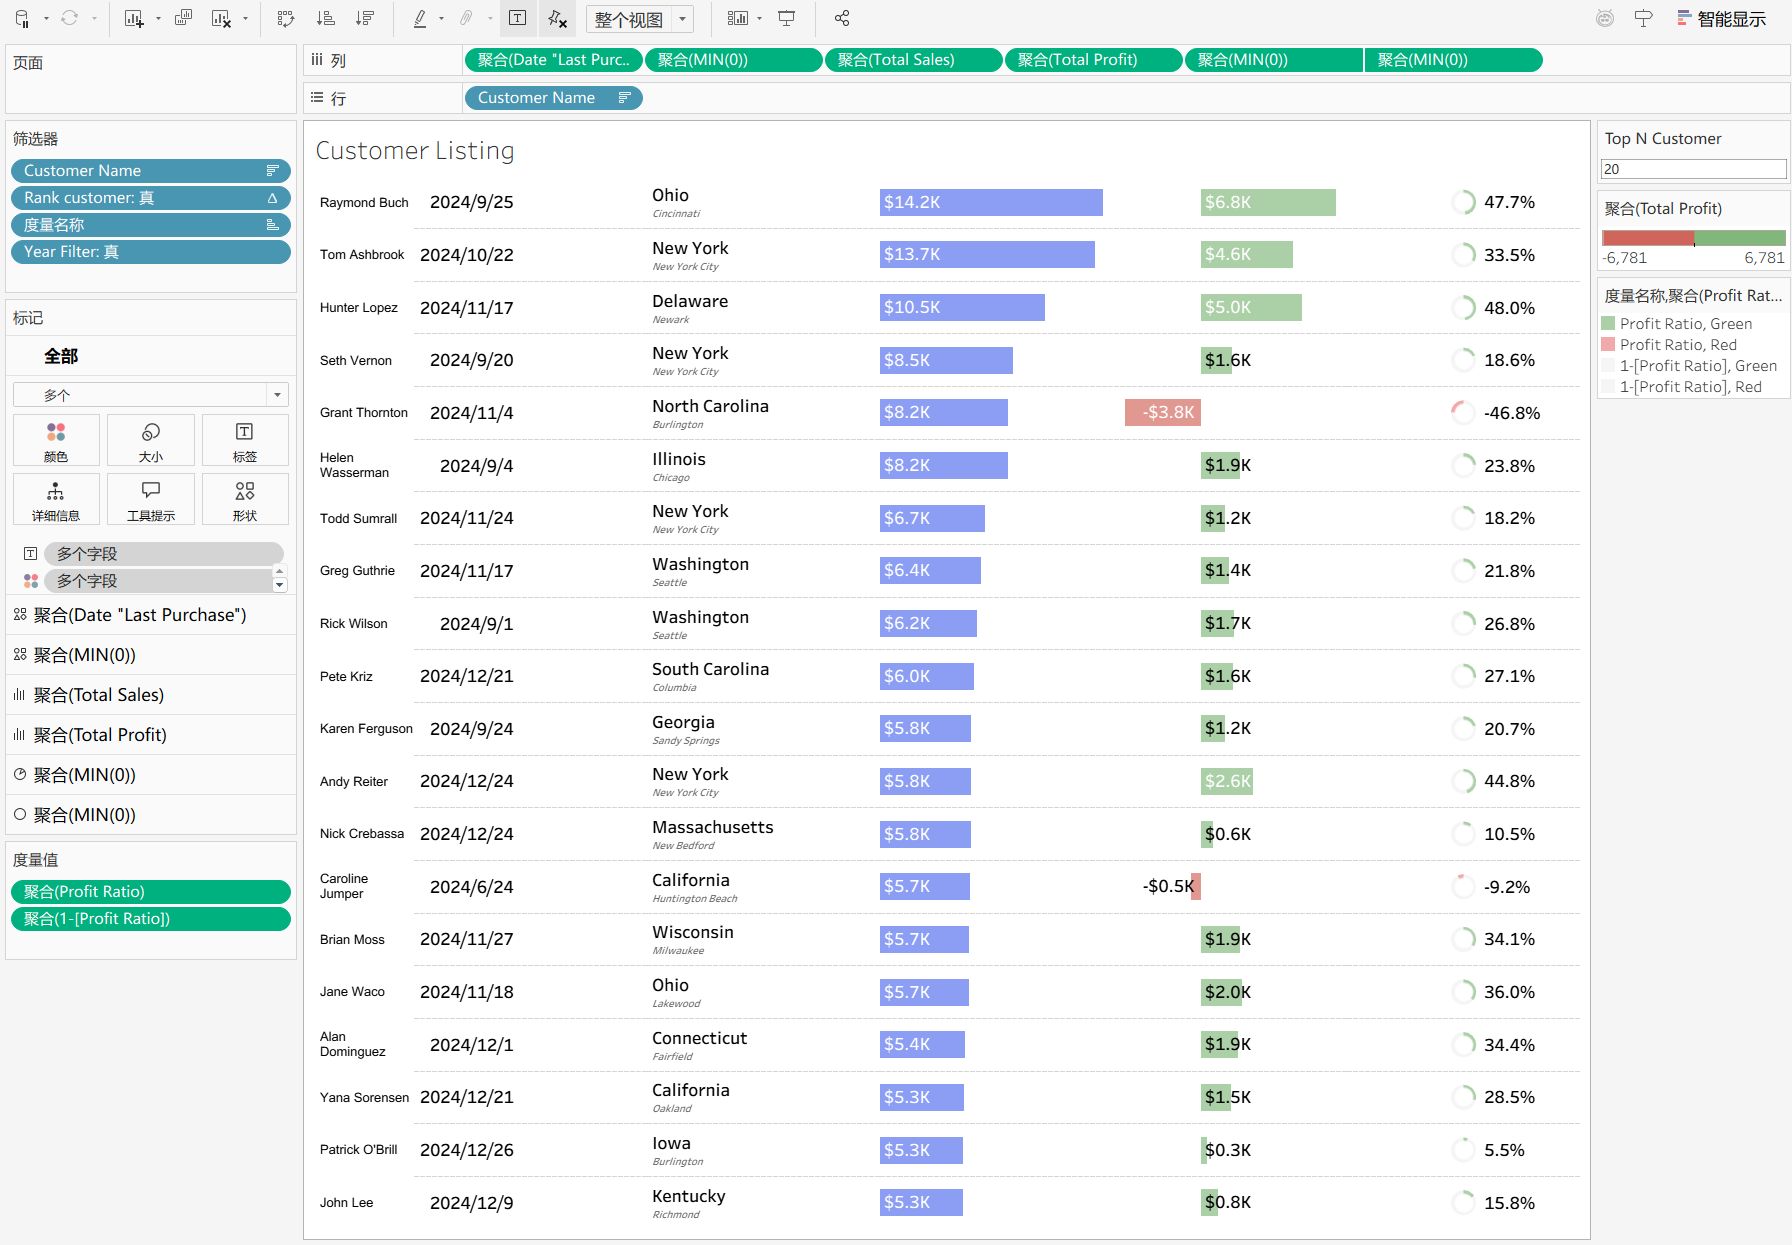
Building "Super Tables" in Tableau: What?s your go-to strategy these days? We have all been there: The stakeholder wants a "simple" text table, but they also want distinct KPIs, sparklines, conditional icons, and progress bars packed into every row. I?ve been weighing the mainstream options to achieve this, but each seems to have a significant trade-off: 1?The Placeholder (MIN(0)) Method Pros: Total visual control. You can format every column independently (shapes, bars, text). Cons: It can become a maintenance nightmare (managing 20+ separate axes) and often impacts rendering performance with large datasets. 2? The Map Layers Technique Pros: Treats the view as a coordinate canvas. It offers unlimited layers and pixel-perfect alignment. Cons: High technical debt for handovers. It also breaks native functionality like standard scrolling and "Export to Excel." 3? Native Interaction (Viz in Tooltip) Pros: Best performance and keeps the UI clean. Cons: Stakeholders often insist on seeing everything "at a glance" and resist hovering or clicking to see details. My question to the #Tableau and #DataAnalytics community: In 2026, what is your standard solution to balance Performance, Aesthetics, and Maintainability? Do you still rely on the MIN(0) grind? Have you embraced Map Layers for tables? Or do you push back for simpler, native designs? I?d love to hear your thoughts and experiences in the comments!